Skip to the campaign journey

Campaign testing

From a first read of the issue
to a tested campaign.

Know what works
before you spend
the money.

Fast, honest feedback on your campaign creative from the people you need to move.

Start here

See what it’s like to build a campaign with Convergent.

Think of us as part of your campaign team. We help you understand the issue, find the people you need to move and work out what to say to them.

Then we put your ideas in front of those people. You see what lands, make changes and test again before committing your budget.

1Survey & segment

Start with a survey.
Find the people to move.

We start with a survey to understand opinion on your issue and what could change it. Then we segment the audience by what moves them.

The groups come from your own research, rather than a generic demographic. They tell you who to focus on and what each audience needs from your campaign.

From survey findings to audience segments

Persuadables

People who can be shifted by the right message. Find out what would move them, then test it.

Illustrative groups. Your segments come from your own research.

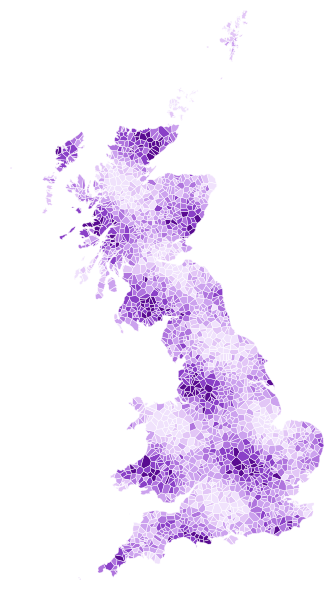
Illustrative map of Great Britain showing varying concentrations of an audience segment across small areas
Selected segment

Persuadables

Postcode sectors to target

  • SW9 8
  • SW2 1
  • SW9 9
Example sectors

Modelled concentration of the selected segment

LowerHigher

Illustrative map. Small-area boundaries and values are examples.

2Model & target

Then model where
those people are.

Once your key segments are defined, we use MRP to model where they are concentrated. You can see where the audiences you need are most likely to be.

We give you postcode sectors to target, so the survey becomes a practical plan for where to focus your campaign. Use the same segments to choose who you test your creative with.

Results overnight.

Reads for audiences as small as a few thousand people.

50+ markets with built-in translation.

3Test & refine

Collaborate with your audience.
Get quick feedback.

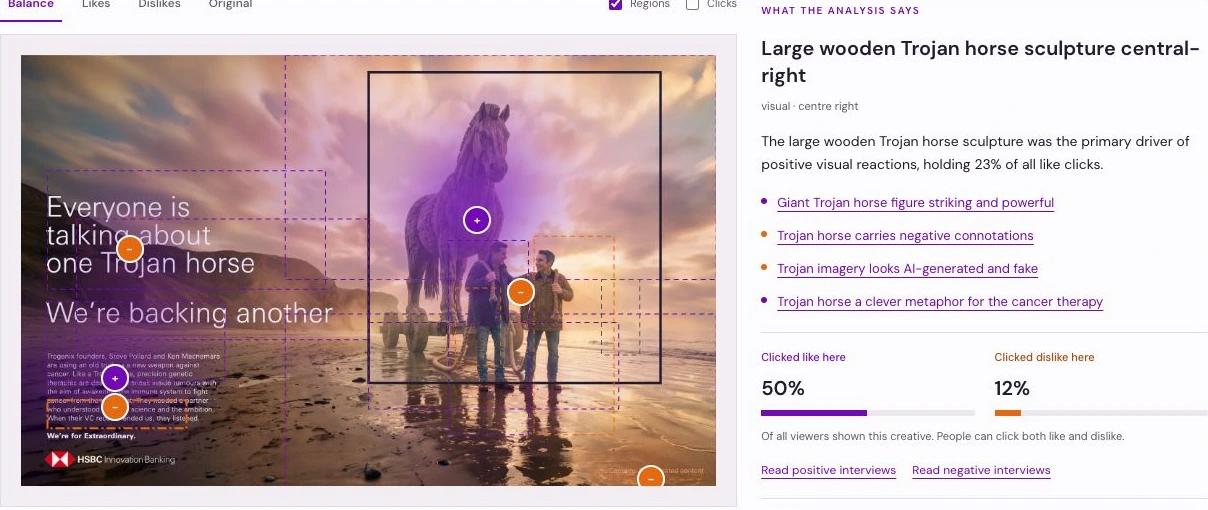
Quick testing, through our self-service platform. People mark what they like and dislike. Our AI interviewer asks why, so you can see which words, images and ideas are driving the reaction.

Start a quick test
  1. 1Upload your creative
  2. 2Pick your audience
  3. 3Hit go
  4. It’s that easy.
Creative explorerConvergent
Creative explorer showing reactions on an HSBC Trojan horse ad, with likes, dislikes and the reasons behind them
See what people react to, then read why.

Every round gives the next one a purpose

Test. Understand.
Refine. Test again.

“I really like the ad itself. I didn't understand it until I read the paragraph.”

Participant · Trojan horse
Selected verbatim interview excerpt

Results in as little as two hours.

From £200 a test.

Want a hand? Talk to our team

4Explore the evidence

Every finding traces back to the people who said it.

Feedback lands in a dashboard you can explore, a written report and a slide deck ready to forward. Click any finding to see the interviews behind it, the share who said it and the uncertainty around that share.

Bert, our AI research assistant, helps you work out what to keep, what to fix and what to drop. Ask a question about your data and it answers from your studies.

Recommendation

Trojan horse

Incorporate the bank's role or the concept of financial backing more explicitly in the headline.

Many viewers mistook the creative for a medical or pharmaceutical ad; clarifying the financial partnership earlier will reduce this confusion.

26.7%

Took it as an ad for the cancer company itself

131 viewers · 90% interval: 20.8%–33.4%
Compare findings directly between creatives

Same creative.
Different logo treatment.

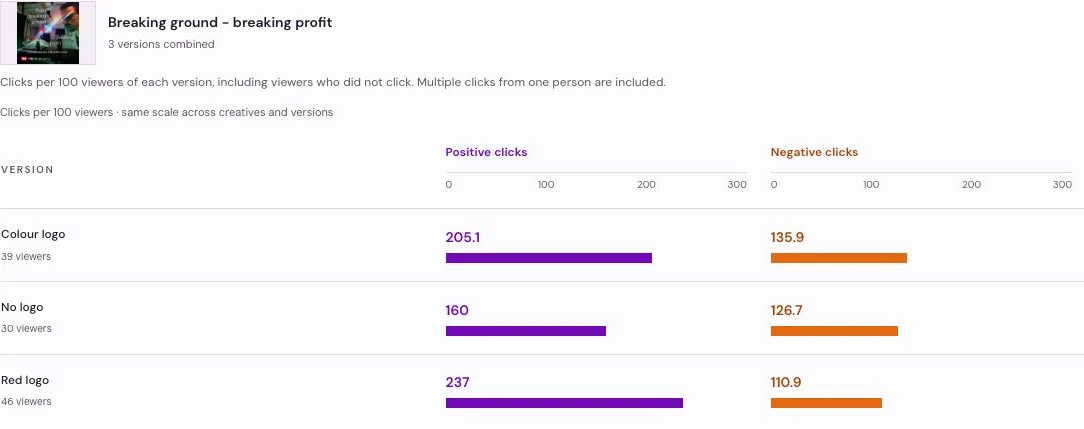
Breaking ground logo comparison. Positive and negative clicks per 100 viewers: Colour logo 205.1 and 135.9; No logo 160 and 126.7; Red logo 237 and 110.9.

Actual platform results. Clicks per 100 viewers; people can click more than once. Open the image to see the detail.

  • Exports to PowerPoint and Word.
  • Compare findings directly between creatives.
  • Transcripts you can read, quote and share.

5Measure cut-through

Then see whether
it cuts through.

A creative that persuades people when they are asked to look at it can still disappear in a feed. We test your finished post among content matched to each person’s interests, so it has to earn their attention.

We measure viewing, scrolling and engagement, and how much the post shifts opinion against a control group that never saw it.

The decision, in one place

Cut-Through results

Persuadables

Swipe to compare all scores →

Example results for persuadables. B has the highest prompted persuasion; C has much higher attention and the best overall score.
MessagePersuasionPrompted · +pointsAttentionIn feed · /100Cut-throughOverall score ↓
Message CBest overall
+10
81
84.2
Message A
+6
42
45.8
Message D
+3
26
27.5
Message B
+12
8
9.4

C performed best.

B was the most persuasive when people were asked to look at it, but barely registered in the feed. C was almost as persuasive and attracted far more attention.

One Cut-Through Score for each of your key audiences.

Illustrative dashboard. Example scores, not study results.

Choose what goes out.
Know who it works for.

Compare results for persuadables, write-offs and amplifiers, then put your budget behind the creative that works for each audience.

Convergent Opinion

Talk to us about
your next campaign

info@convergent-opinion.com Download the brochure PDF · 8 pages

We are a UK polling and research consultancy. We ran polling for Labour through the 2024 general election, set up research operations for two think tanks, and now work with campaigns, advocacy groups and brands.

Members of the British Polling Council and an MRS Company Partner.

Why you can trust us